
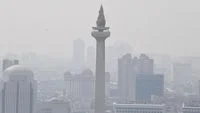
In an era marked by escalating environmental challenges, monitoring real-time air quality has transitioned from a niche technical task into an essential daily health precaution for millions of urban residents and rural populations alike. Recent spikes in atmospheric pollution, compounded by seasonal forest and land fires—frequently referred to in Southeast Asia as Kebakaran Hutan dan Lahan (karhutla)—and sudden volcanic eruptions, have degraded air conditions across various regions. For vulnerable demographics, including children, the elderly, and individuals with pre-existing respiratory or cardiovascular conditions, staying informed about the air they breathe is critical to mitigating severe health risks before stepping outdoors.
Modern smartphone technology has streamlined this process, empowering citizens to evaluate local atmospheric safety effortlessly. By leveraging widely accessible digital tools such as Google Maps, specialized air quality monitoring applications like IQAir AirVisual, and official meteorological portals managed by state agencies such as the Meteorology, Climatology, and Geophysical Agency (BMKG), individuals can access comprehensive environmental metrics within seconds. These platforms typically display the Air Quality Index (AQI) alongside specific particulate matter concentrations, most notably PM2.5, offering a transparent breakdown of environmental safety prior to engaging in outdoor activities.
Understanding the Mechanisms of Air Quality Monitoring
The imperative to monitor atmospheric conditions stems from a convergence of anthropogenic and natural phenomena. Urban centers routinely battle elevated pollution levels driven by vehicular emissions, industrial output, and construction dust. Concurrently, regional agricultural burning and prolonged dry spells frequently ignite extensive forest and land fires, blanketing vast territories in hazardous haze. Furthermore, tectonic activity introduces geological hazards, wherein active volcanoes spew fine ash particles into the stratosphere, significantly altering local air chemistry.
To quantify these invisible hazards, environmental scientists rely on standardized metrics. The Air Quality Index serves as a composite numerical scale designed to communicate how polluted the air currently is or how polluted it is forecast to become. A lower AQI value indicates clean air with minimal health impact, whereas an escalating index warns of mounting toxicity and corresponding public health advisories. Concurrently, particulate matter—specifically PM2.5 and PM10—represents microscopic solid or liquid droplets suspended in the air. PM2.5 denotes particles with a diameter of 2.5 micrometers or smaller, roughly thirty times smaller than the width of a human hair. Because of their minute scale, these particles bypass the body’s natural nasal filtration systems, penetrating deep into the pulmonary alveoli and eventually crossing into the bloodstream, posing long-term systemic health threats.
Step-by-Step Guide: Monitoring Air Quality via Smartphone
Accessing vital environmental data no longer requires specialized laboratory equipment; a standard mobile device connected to the internet is sufficient. Several mainstream applications and platforms offer localized, up-to-the-minute atmospheric reports.
Checking Air Quality Through Google Maps
Google Maps has evolved beyond a mere navigation tool into an environmental awareness platform via its integrated Air Quality layer. This feature allows users to visualize real-time pollution metrics directly over geographic maps in supported regions.
To utilize this function, users must open the Google Maps application on their smartphone, tap the layers icon typically located in the top right corner of the screen, and select the "Air Quality" option from the menu. The map will subsequently overlay color-coded markers across various neighborhoods and districts, accompanied by precise AQI readings. Data is dynamically aggregated from a combination of ground-based government monitoring stations, low-cost sensor networks, and advanced atmospheric modeling systems, offering a comprehensive overview of urban and rural pollution gradients.
Leveraging Dedicated Applications: IQAir AirVisual
For deeper analytical insights, third-party applications provide granular data on global air pollution. IQAir AirVisual is among the most prominent platforms utilized by international researchers and the general public alike.
Upon downloading and launching the application, users can grant location permissions or manually search for specific cities, districts, or neighborhoods. The interface presents a prominent circular dial displaying the local AQI, alongside a detailed breakdown of dominant pollutants, historical pollution trends, and localized weather forecasts. Crucially, the app highlights PM2.5 and PM10 concentrations, translating complex numerical data into actionable health recommendations, such as advising whether outdoor exercise should be avoided or if protective N95 masks are necessary.
Consulting Official Meteorological Portals: BMKG
In nations frequently affected by localized environmental hazards, national meteorological institutions provide authoritative, localized data. In Indonesia, the Badan Meteorologi, Klimatologi, and Geofisika (BMKG) serves as the primary scientific authority tracking atmospheric phenomena, including particulate matter concentrations.
Citizens can access BMKG’s official web portal or dedicated mobile interfaces to review empirical data concerning PM2.5 distribution across various provinces and cities. The platform provides systematic updates based on dense observation networks, allowing researchers and everyday citizens to cross-reference commercial application data with official state records. This institutional oversight ensures that disaster mitigation policies and public safety announcements are grounded in verified, peer-reviewed scientific methodologies.
Decoding the Metrics: AQI, PM2.5, and Volcanic Ash Hazards
Interpreting environmental reports requires a foundational understanding of the terminology utilized by monitoring agencies. The AQI is universally segmented into distinct color-coded tiers: green indicates good air quality; yellow denotes moderate conditions; orange signals unhealthiness for sensitive groups; red represents general unhealthiness; purple warns of very unhealthy conditions; and maroon signifies hazardous circumstances capable of triggering emergency public health responses.
The inclusion of PM2.5 as a primary benchmark is deliberate. Because these fine particles remain suspended in the atmosphere for extended periods and travel vast distances via wind currents, they represent the most pervasive threat to urban populations. Prolonged exposure to high concentrations of PM2.5 is scientifically linked to chronic bronchitis, asthma exacerbations, reduced lung function development in children, and heightened incidences of cardiovascular mortality.
Beyond standard industrial and vehicular pollution, environmental assessments must account for geological disruptions. Volcanic eruptions eject massive plumes of tephra, sulfur dioxide, and finely pulverized rock known as volcanic ash. Unlike carbon-based soot, volcanic ash consists of hard, jagged mineral particles. While coarser fragments (classified primarily under PM10 or larger) tend to settle quickly and primarily induce mechanical irritation in the eyes, nose, and upper respiratory tract, finer microscopic fractions can penetrate deep into the lungs.
Health Implications and Short-Term vs. Long-Term Risks
The human body possesses robust defense mechanisms against large particulate matter, utilizing nasal hairs, mucus membranes, and coughing reflexes to trap and expel foreign bodies. However, these natural barriers are largely ineffective against sub-micron and fine particulate pollution.
Short-term exposure to acute air pollution—whether originating from sudden forest fire smoke, urban smog inversions, or volcanic ashfall—frequently manifests as immediate physical discomfort. Symptoms include stinging eyes, scratchy throats, persistent coughing, nasal congestion, and skin irritation. For healthy adults, these symptoms typically subside rapidly once the individual relocates to an indoor, filtered environment.
Conversely, the demographic at greatest risk comprises individuals suffering from chronic respiratory conditions such as chronic obstructive pulmonary disease (COPD) and asthma, as well as patients with underlying cardiovascular ailments. For these vulnerable groups, even a minor spike in PM2.5 concentrations or a brief drift of volcanic ash can precipitate medical emergencies, requiring hospitalization, increased medication reliance, or oxygen therapy.
Long-term chronic exposure presents an even graver epidemiological challenge. Continuous inhalation of polluted air over years or decades contributes to systemic inflammation, accelerated arterial plaque buildup, diminished cognitive performance, and a heightened risk of lung malignancies. Public health analysts emphasize that monitoring air quality is not merely a matter of comfort on hazy days, but a vital preventive healthcare practice.
Broader Implications and Public Preparedness
As climate change alters weather patterns, extending dry seasons and intensifying regional wildfires, and as tectonic instability continues to impact densely populated volcanic arcs, the frequency of severe air quality episodes is projected to rise. Consequently, institutional reliance on real-time monitoring infrastructure has become a cornerstone of modern disaster management and urban resilience planning.
Governments and municipal authorities increasingly utilize real-time air quality data to implement timely policy interventions. These measures include ordering school closures during severe haze crises, issuing mandatory mask-wearing advisories, restricting heavy-duty vehicular traffic in congested downtown districts, and halting non-essential industrial operations during atmospheric stagnation events.
For the individual citizen, proactive digital engagement with air quality metrics fosters a culture of preparedness. By checking smartphone applications prior to planning outdoor excursions, commuting, or engaging in physical exercise, individuals can make informed decisions regarding personal protection. Utilizing appropriate respiratory protection—such as certified particulate respirators rather than standard cloth masks—during pollution spikes or ashfall events drastically reduces the inhalation of hazardous particles.
Ultimately, while systemic environmental remediation requires large-scale policy shifts, international cooperation, and aggressive carbon reduction strategies, individual awareness remains the first line of defense. Utilizing accessible digital platforms to track real-time air quality equips populations with the knowledge necessary to navigate an increasingly complex environmental landscape safely and resiliently.
